Awhile ago, when this blog was still very new, I wrote about a rather bizarre demographic argument which holds that since conservatives (or in the previous case, simply people who live in red states) have more children than liberals or blue staters, that this was going to cause a long-term shift towards conservatism in our country. As I wrote at the time, the argument is flawed in numerous ways, the most important of which is that our natural birth rates are very low historically speaking and are swamped out by immigration.
But the argument apparently won't die. In yesterday's Opinion Journal, (a fount of right-wing opinion published by the Wall Street Journal), we've got some dufus by the name of Arthur Brooks making the argument again. And not only does he make all the same mistakes of previous pundits, he seems to have a very serious math problem. Let me reproduce the meat of his argument:
But the data on young Americans tell a different story. Simply put, liberals have a big baby problem: They're not having enough of them, they haven't for a long time, and their pool of potential new voters is suffering as a result. According to the 2004 General Social Survey, if you picked 100 unrelated politically liberal adults at random, you would find that they had, between them, 147 children. If you picked 100 conservatives, you would find 208 kids. That's a "fertility gap" of 41%. Given that about 80% of people with an identifiable party preference grow up to vote the same way as their parents, this gap translates into lots more little Republicans than little Democrats to vote in future elections. Over the past 30 years this gap has not been below 20%--explaining, to a large extent, the current ineffectiveness of liberal youth voter campaigns today.
Okay, we've seen all this before (although I have no way of verifying Brooks' numbers on children, which comes out to a 41/59 split in favor of conservatives; I will accept this as true for the sake of argument.) But next Brooks makes some rather bold predictions, and this is where things get really hairy:
Consider future presidential elections in a swing state (like Ohio), and assume that the current patterns in fertility continue. A state that was split 50-50 between left and right in 2004 will tilt right by 2012, 54% to 46%. By 2020, it will be certifiably right-wing, 59% to 41%. A state that is currently 55-45 in favor of liberals (like California) will be 54-46 in favor of conservatives by 2020--and all for no other reason than babies.
You don't really need to do the math to know that this is certifiable nonsense. But let's do it anyway, starting with Ohio. It's a fairly simple thing to see if we can start with Brooks' assumptions and end up with his results.
The population of Ohio is roughly 11.4 million. In 2002, there were 159,192 births, and 111,550 deaths. Assuming those numbers haven't changed much, and that they'll remain the same going from 2004 to 2012, that would be 892,000 Ohioans that will have died between those years, and 1.27 million that will have been born. We'll ignore the fact that some of those being born will also be the ones who die. What this basically means is that the total population in Ohio in 2012 (ignoring migration -- more on that later) will be roughly 11.8 million, 10.5 million of whom were alive during or before 2004.
If those 10.5 million were split 50/50 between liberal and conservative, and the 1.27 million extras are split 41/59 between liberal and conservative, how much would this change the overall split? We can just multiply the numbers by the percentages to get the totals. We get 5.77 million liberals and 6 million conservatives in 2012. That's less than a 49/51 split. For all practical purposes, unchanged.
How the living hell does Brooks come up with a 46/54 split? I'll have to email his ass to find out.
It might also be worth pointing out something rather obvious that Brooks seems to have missed: Newborns can't vote. No matter what today's fertility rates are, they can't affect the voting age population until 18 years from now. Yet Brooks says that we'll get a 46/54 split by 2012 if current patterns in fertility continue. Unless they're planning on lowering the voting age, this can't be the case. The voting age population of 2012 vs. that of 2004 will be determined by what the fertility rates were 12 to 20 years ago.
But really, how much does the native birth rate affect ongoing demographical changes in Ohio or anywhere else in the country? The answer, as I wrote about previously, is that it hardly affects it at all. Our population changes very, very slowly, just barely in the positive direction, if we rely on native births alone. We live in a society with historically very low fertility and very low mortality, which means that the population doesn't turn-over very fast. Most of our demographic changes are due to immigration, something that Brooks astoundingly doesn't even mention.
So, how do immigrants affect our numbers? Consider the following chart:

You can see that for Ohio's overall net population gain over the last 5 years, nearly 1/3rd of it was from immigrants. (I'm going to ignore the out-migrants, because for all we know, many of them could have been foreign-born.) And immigrants overwhelmingly vote Democratic, by about a 60/40 split. If we assume that immigrants make up exactly 1/3 of the population gain, and if we go with the 41/59 split for native additions, then the overall new additions will have a 47/53 split. In other words, immigration almost completely erases the native birth rate slant in favor of conservatives. And Ohio is a low immigration state. Let's look at a high immigration state like California. Unfortunately, I don't have a nifty graphic, but this passage gives us the numbers we need:
California's Demographics in a Nutshell "The arithmetic of California's recent annual growth rate is simple: nearly 600,000 births (more than one a minute) minus about 225,000 deaths, plus more than 220,000 foreign immigrants, minus a quarter- million net loss to other states. That produces a net gain of around 350,000 a year...
So California gains 350,000 people a year, and nearly two-thirds of that gain consists of immigrants. Using the same assumptions as above, this means that new additions to California's population lean liberal by a 54/46 split. In other words, demographically speaking, California is becoming more liberal, not less. And yet Brooks is predicting that it will be strongly conservative by 2020. What a goddamned fool.
But there's still one question left: What then explains the ineffectiveness of youth voter campaigns? Putting aside the fact that they're not ineffective at all, given the fact that the youth turned out more strongly in 2004 than in any recent election, the answer is simple. The youth make up a smaller percentage of the population than they ever have before. That's what happens when people live longer and have fewer children. The trend will continue in this direction. Nevertheless, let's look at what the trend in youth voting has been:
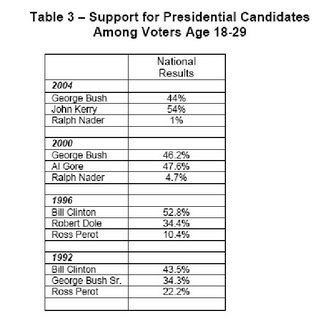
If Brooks' thesis were correct, we'd expect to see the Democrats losing youth voters and the Repubilcans gaining them. That's not the case. In fact, the Democrats captured their highest percentage of the youth vote in 2004, and the lowest in 1992. If anything, the Democrats are increasing their share of the youth vote.